
Melbourne Is Undersupplied. Badly.

Josh Tay
Last Updated on 08-Aug-2025
I’m not trying to sensationalize this. But Melbourne is in a serious housing shortage right now. As of May 2025, Melbourne is facing a significant housing supply crunch.
- New housing approvals have declined sharply,
- construction activity is at its lowest level in over a decade, and
- rising costs are forcing developers to pause or delay projects.
This slowdown is tightening the housing market further.
Why Is Supply So Tight?
Since the COVID-19 pandemic, building costs have surged by 30–40%, squeezing developer margins and causing many projects to become financially unviable.
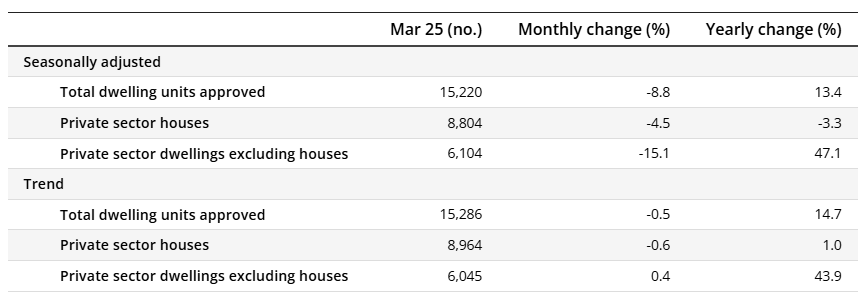
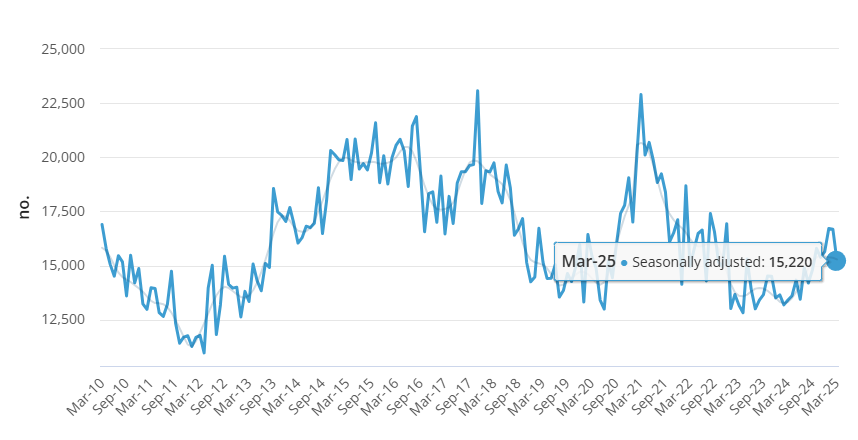
According to the latest ABS data, total dwelling approvals dropped 8.8% to 15,220 in March 2025, with private sector unit approvals down nearly 19% year-on-year. This means fewer new homes are entering the market, especially high-density apartments, which are critical to maintaining housing affordability in Melbourne.
Dwellings Approved (March 2025 key figures)
 Source: https://www.abs.gov.au/statistics/industry/building-and-construction/building-approvals-australia/latest-release
Despite the Victorian government’s ambitious plan to add over 300,000 new homes by 2051 - focused on fast-tracking development around 50 train and tram zones - the current pace of construction remains slow. The shortage of cranes in the skyline today signals fewer apartments will be completed in the next two to three years.
Demand Remains Strong
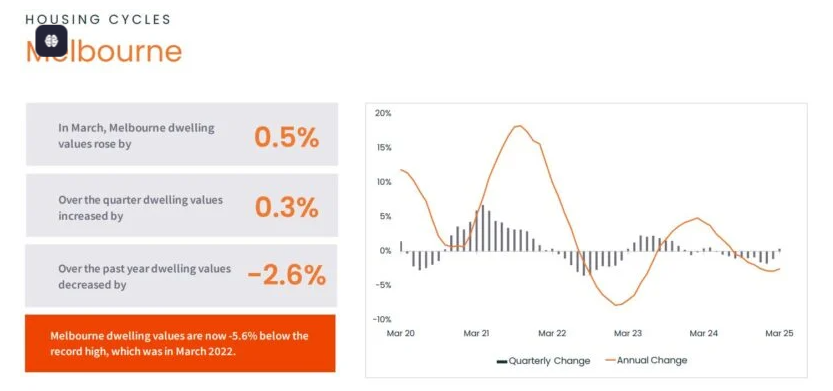
Demand for homes close to public transport, jobs, and services continues to climb, driven by population growth and migration. This widening gap between supply and demand is pushing up both property prices and rents.
The Reserve Bank of Australia has held the cash rate steady at 4.10%, but with inflation easing, markets expect rate cuts to begin as soon as May 2025. Rates could fall to around 3.10% by the end of the year, marking the first cuts in years.
Rental Market Remains Highly Competitive
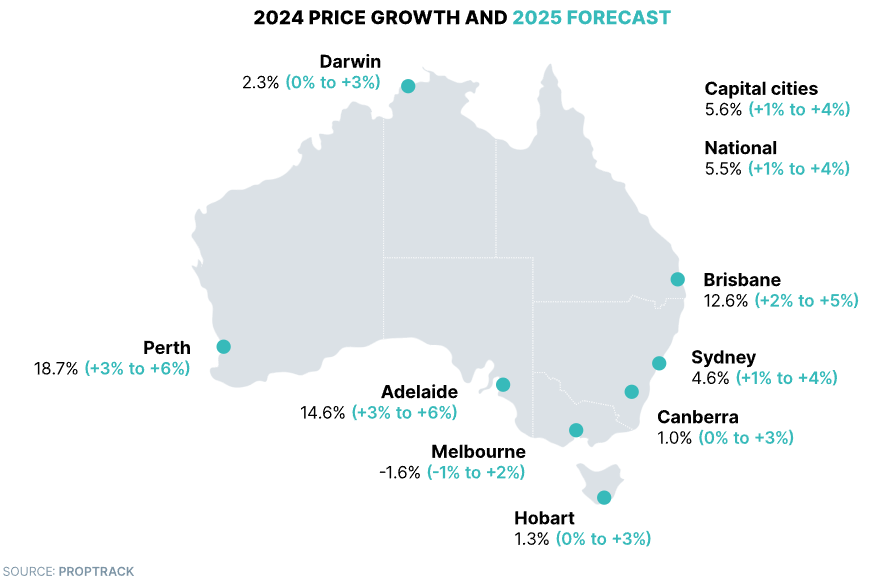
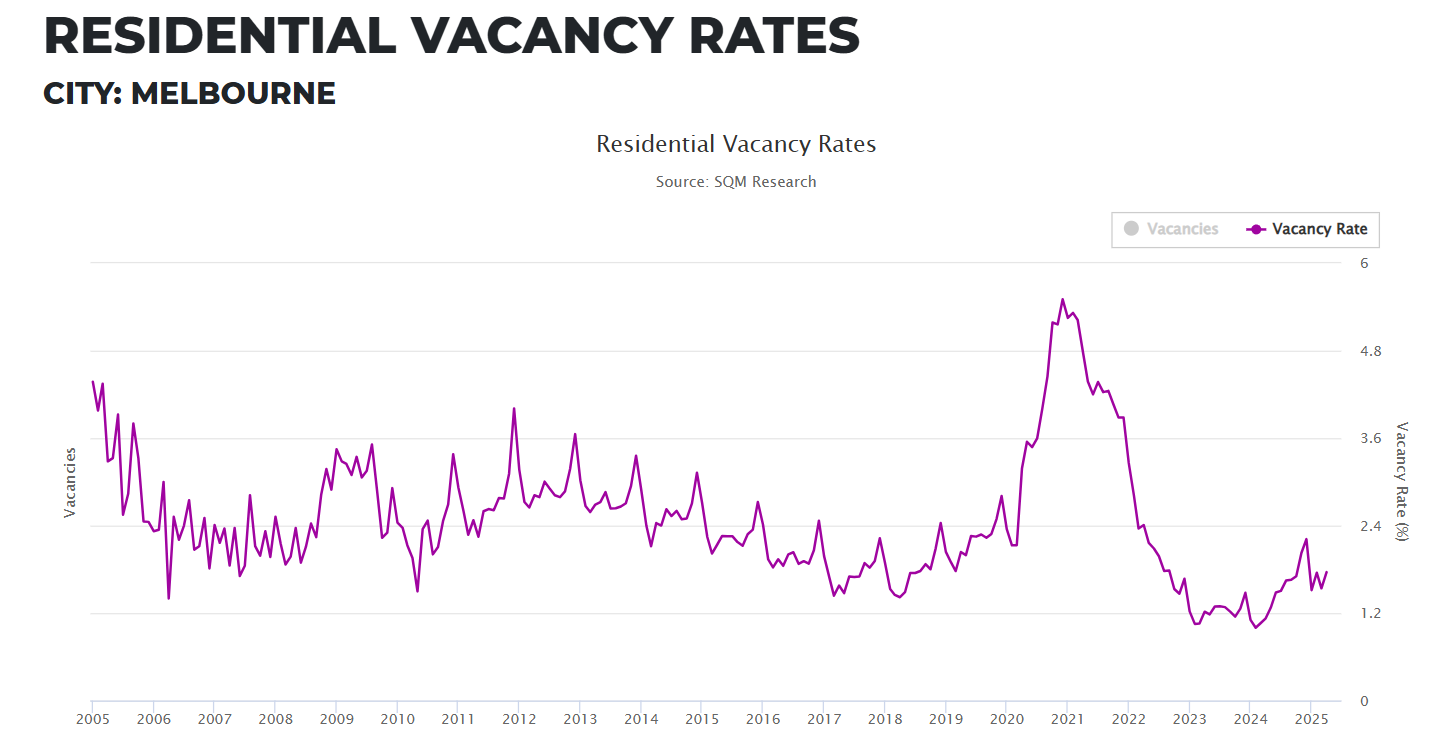
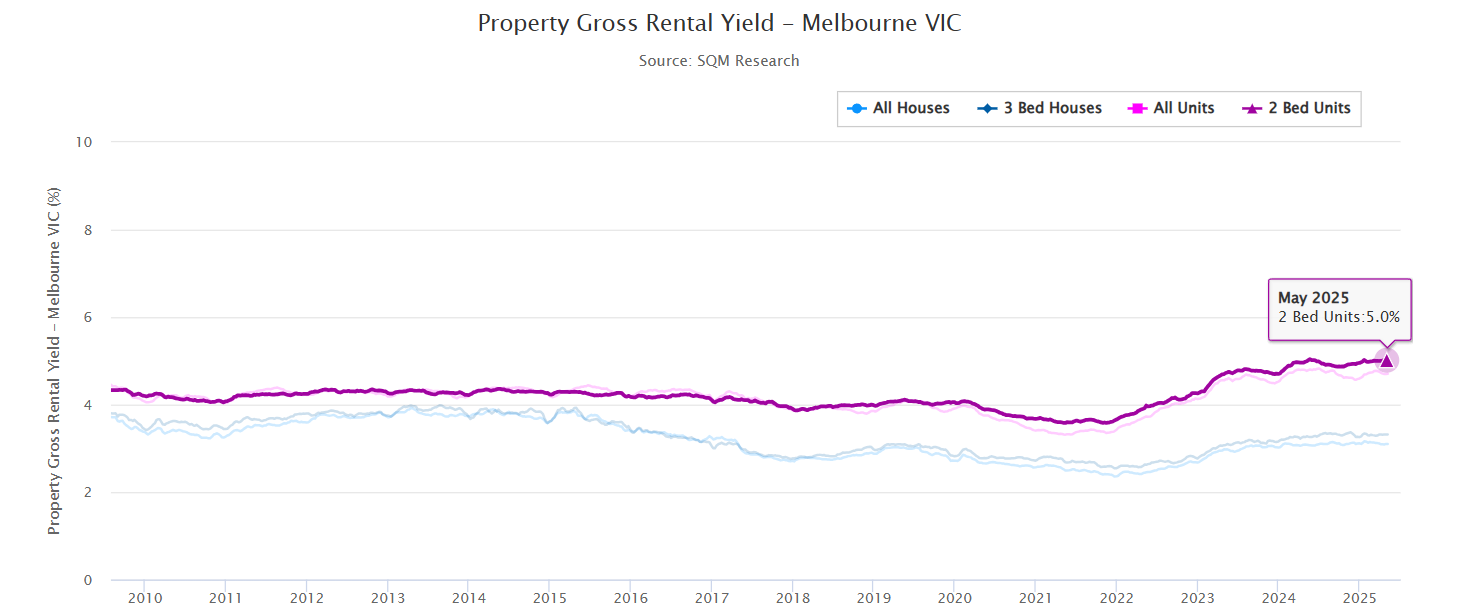
Melbourne’s rental market is one of the tightest in Australia. Median rents climbed to $575 per week by March 2025, a 3.6% increase in the quarter alone. Vacancy rates remain low at approximately 1.5%, reflecting strong demand and limited supply.
Unit Rental Price (March 2025 Quarter)
| Region | Median Rent | QOQ Change | YOY Change |
| Sydney | $720 | 2.9% | 2.9% |
| Melbourne | $570 | 3.6% | 3.6% |
| Brisbane | $610 | 1.7% | 5.2% |
| Adelaide | $525 | 2.9% | 9.4% |
| Perth | $650 | 4.8% | 8.3% |
| Hobart | $490 | 2.1% | 4.3% |
| Darwin | $560 | 1.8% | 1.8% |
| ACT | $580 | 0.0% | 0.3% |
| Capital Cities | $640 | 3.2% | 6.7% |
Following the recent federal election, Prime Minister Anthony Albanese’s government continues to prioritize boosting housing supply without increasing taxes on investors. One key incentive is the 12-month stamp duty concession on off-the-plan apartments, units, and townhouses, which began on October 21, 2024, and will expire on October 21, 2025.
This concession removes previous price caps and eligibility restrictions, allowing buyers of properties over $1 million to save significantly on stamp duty.
I’ve been doing this for almost two decades. I’ve seen markets rise, dip, pause, and roar back. Melbourne right now? It’s poised for increased activity.